Dissociative Experiences Scale (DES-II)
Start the test- Ages: 18+
- 28 questions
- ~4 min
- Free
РусскийУкраїнська中文NederlandsDeutschMagyarFrançaisSvenskaTürkçeEspañolRomânăفارسیPolskiAzərbaycan diliItalianoPortuguêsالعربية
Test guides
DES-II validity and reliability
Review the original DES studies, the revised DES-II response format and what the historical cutoff of 30 can support in different populations.
Scientific evidence for the DES and DES-II
The scale's evidence has developed across decades, different response formats and different diagnostic targets. A sound interpretation names those distinctions instead of attaching one universal reliability or accuracy percentage to every use.
| Analysis | Reported finding | What to retain when citing it |
|---|---|---|
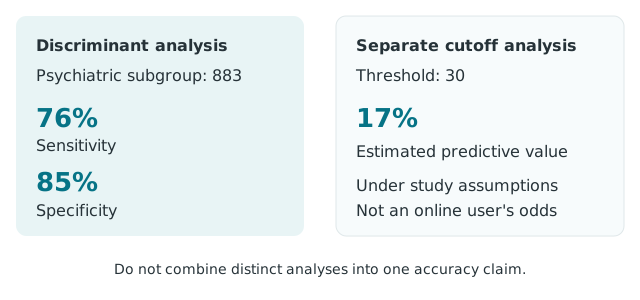
| Discriminant analysis, psychiatric subgroup of 883 | 76% sensitivity and 85% specificity | These figures describe the classification analysis in that subgroup. |
| Separate threshold analysis | At 30, estimated positive predictive value of 17% under the study assumptions | The base rate and diagnostic target are essential. The estimate is not an individual probability for all users. |
What reliability can tell us
The original 1986 development study included clinical and non-clinical groups with 10–39 people per group. It reported good test–retest and split-half reliability and significant relationships between item scores and the overall score. These findings supported measuring dissociative experiences, but the development samples were small. [1]
Test–retest reliability concerns consistency across administrations under suitable conditions. Internal consistency concerns relationships among items. Neither establishes the cause of an experience or turns a total into a clinical diagnosis.
Know what was measured
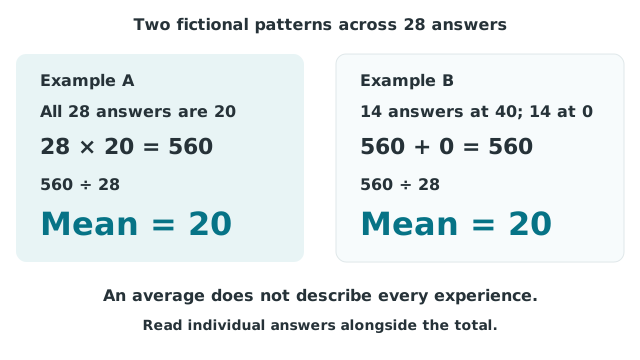
What changed in DES-II?
Carlson and Putnam's 1993 update reviewed evidence on measurement and use and included a revised, easier-to-score form. DES-II offers the percentage choices in a different response format from the original line-marking approach. [2]
Historical findings about the DES remain relevant to the development of the measure. They should still be described as findings about the form and procedure actually studied. A new interface or translation should not acquire a performance claim solely by sharing the name.
The 1993 multicentre diagnostic study
Carlson and colleagues analysed 1,051 participants and a subgroup of 883 designed to better represent a typical psychiatric facility's diagnostic base rates. The target was the condition then called multiple personality disorder, now generally termed dissociative identity disorder. [3]
Discriminant analysis in the more representative subgroup gave 76% sensitivity and 85% specificity. The paper also separately evaluated a cutoff of 30. Those percentages describe the discriminant analysis; they should not be presented as universal accuracy estimates for every DES-II ≥30 screen. [3]
Read the figures with their study context
Why predictive value depends on the setting
The paper's base-rate calculations estimated that 17% of people scoring at least 30 would have the target disorder under the conditions considered. A positive screen was therefore not equivalent to that diagnosis. The estimate is not a current diagnostic probability for someone completing DES-II on LuriaLab. [3]
- Sample: a psychiatric population is different from a general website audience.
- Target: detecting one disorder is different from describing dissociation broadly.
- Method: a statistical classification function and a fixed numerical cutoff are distinct analyses.
Check whether the evidence fits the use
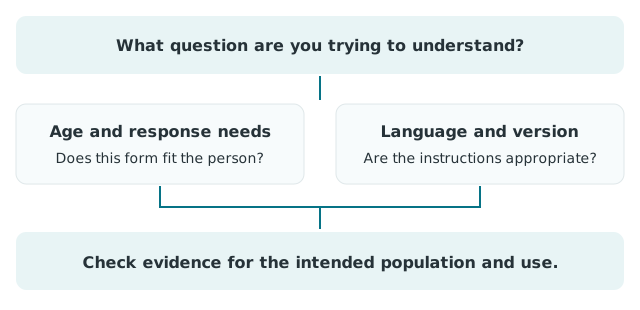
What remains uncertain
The DES contains both common absorption and more disruptive experiences. Later instrument-development work, including development of the DSS, addressed a different emphasis on clinically disruptive symptoms. Measures can therefore correlate without being interchangeable. [4]
The selected studies do not establish a universal meaningful-change threshold, diagnose trauma exposure or validate every translated online implementation. Interpretation still needs the actual experiences, context and appropriate clinical assessment.
For the practical meaning of a mean score, read the results guide.
References
- Bernstein & Putnam (1986). Development, reliability, and validity of a dissociation scale. Journal of Nervous and Mental Disease, 174, 727–735. DOI: 10.1097/00005053-198612000-00004.
- Carlson & Putnam (1993). An update on the Dissociative Experience Scale. Dissociation, 6, 16–27. Paper and DES-II form.
- Carlson et al. (1993). Validity of the DES in screening for multiple personality disorder: a multicenter study. American Journal of Psychiatry, 150, 1030–1036. DOI: 10.1176/ajp.150.7.1030.
- Carlson et al. (2018). Development and validation of the Dissociative Symptoms Scale. Assessment, 25, 84–98.