Dissociative Experiences Scale (DES-II)
Start the test- Ages: 18+
- 28 questions
- ~4 min
- Free
РусскийУкраїнська中文NederlandsDeutschMagyarFrançaisSvenskaTürkçeEspañolRomânăفارسیPolskiAzərbaycan diliItalianoPortuguêsالعربية
Test guides
DES-II score interpretation
Two people with a DES-II mean of 20 can have very different item profiles. Interpretation depends on which experiences occur and how they affect daily life.
Understanding a DES-II result
A DES-II mean describes the average frequency ratings across 28 experiences. Higher means generally reflect more frequent endorsement. They do not identify a cause, confirm trauma or establish a dissociative disorder. The experiences behind the total remain essential. [1] [2]
| Context | Description |
|---|---|
| Frequency | Which individual experiences drive the score? |
| Setting | Did they occur during a familiar, absorbing activity or in an unexpected setting? |
| Impact | Were there gaps in memory, disruption to daily activities or concerns about safety? |
| Course | What changed between assessments, including circumstances and understanding of the items? |
Frequency is not the whole clinical picture
Two people can have the same average while answering quite differently. One may endorse absorption frequently; another may report a smaller number of experiences involving memory or detachment. The average does not establish that their practical difficulties are equivalent.
- What happens? describe the experience in your own words, without deciding in advance what diagnosis it represents.
- What is its impact? note whether it interrupts responsibilities, relationships or a sense of safety.
- What is its pattern? explain frequency, circumstances and what you notice before and afterwards.
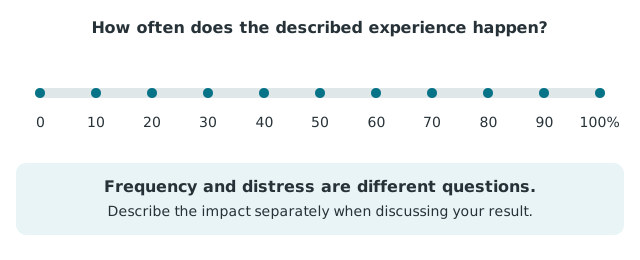
A distressing experience deserves attention even when the mean is relatively low. A single number cannot decide which individual symptom matters most.
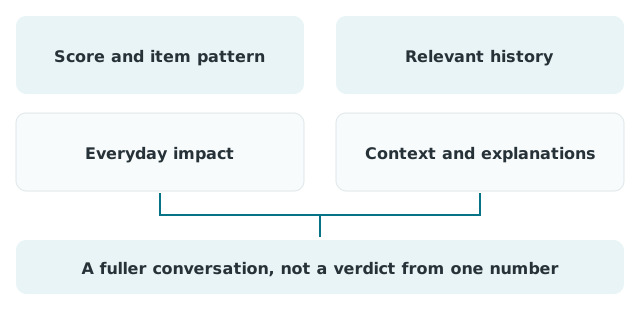
What a score needs alongside it
Does 30 mean a dissociative disorder?
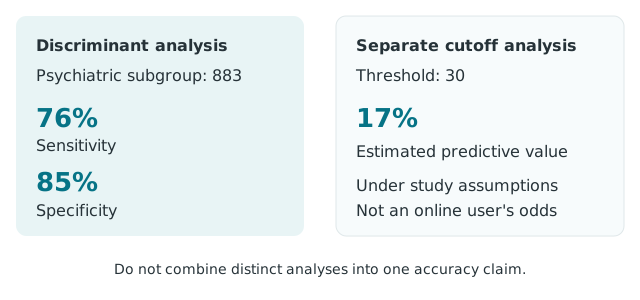
No. A threshold around 30 has been examined as a screening flag. The 1993 multicentre study considered a specific diagnostic target, then called multiple personality disorder. Its results should not be treated as diagnostic rules for every form of dissociation. [3]
The study's base-rate calculations estimated a positive predictive value of 17% for scores of at least 30 under the conditions considered. That is not a personal probability for a current LuriaLab user. It illustrates that many high scorers did not have the target diagnosis, and that the population being screened matters. [3]
For the distinction between cutoff analyses, sensitivity and predictive value, see the scientific evidence guide.
Why study context matters
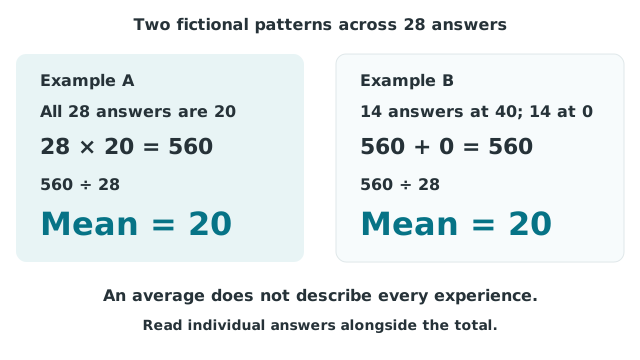
An example of what the mean hides
In one fictional set, all 28 values are 20. In another, 14 values are 40 and 14 are zero. Both total 560 and average 20. Yet the second pattern is more uneven. Neither calculation tells us which experiences were endorsed or how disruptive they were.
This is why an interpretation should not stop at a coloured band. Preserve the answers as well as the mean when preparing for a professional conversation.
Look beyond the total
What does a changed score mean?
A different score means the reported frequencies changed. To understand it, consider which answers changed, how the questions were understood and what was happening at the time. A small shift is not automatically a meaningful clinical improvement or deterioration.
This guide does not supply a universal reliable-change threshold or recovery cutoff. A move from above 30 to below it does not, by itself, establish that a condition has resolved.
A changed score needs context
- Keep the method: compare results only when the version and scoring rule are identified.
- Keep the context: a small numerical shift or threshold crossing is not, by itself, proof of meaningful clinical change.
Taking the next step
Bring the result and concrete examples to a qualified professional if experiences are persistent, disruptive or concerning. You do not need to reach a particular number to ask for help. If completing the questionnaire feels overwhelming, pause; finishing it is not a requirement for support.
The score cannot verify the occurrence of a particular past event or settle questions about an uncertain memory. It is a report of current answers, not evidence that establishes an event history.
References
- Bernstein & Putnam (1986). Development, reliability, and validity of a dissociation scale. Journal of Nervous and Mental Disease, 174, 727–735. DOI: 10.1097/00005053-198612000-00004.
- Carlson & Putnam (1993). An update on the Dissociative Experience Scale. Dissociation, 6, 16–27. Paper and DES-II form.
- Carlson et al. (1993). Validity of the DES in screening for multiple personality disorder: a multicenter study. American Journal of Psychiatry, 150, 1030–1036. DOI: 10.1176/ajp.150.7.1030.
- Carlson et al. (2018). Development and validation of the Dissociative Symptoms Scale. Assessment, 25, 84–98.