Dissociative Experiences Scale (DES-II)
Start the test- Ages: 18+
- 28 questions
- ~4 min
- Free
РусскийУкраїнська中文NederlandsDeutschMagyarFrançaisSvenskaTürkçeEspañolRomânăفارسیPolskiAzərbaycan diliItalianoPortuguêsالعربية
Test guides
DES-II scoring
Add all 28 DES-II frequency ratings and divide by 28. LuriaLab reports the mean to one decimal place on a scale from 0 to 100.
How DES-II scoring works
The DES-II summarises responses to 28 items about dissociative experiences. Its standard total is the arithmetic mean of the item values. The range is 0–100; it is not a count of symptoms or a probability of having a dissociative disorder. [1] [2]
| Response pattern | Sum of 28 ratings | Reported mean |
|---|---|---|
| All 28 ratings at 20% | 560 | 20.0 |
| 14 ratings at 40% and 14 at 0% | 560 | 20.0 |
| One rating at 100% and 27 at 0% | 100 | 3.6 |
Frequency, not distress intensity
The revised form offers values from 0% to 100% in ten-point steps. Choose how often the described experience happens, rather than how upsetting it feels. Follow the form's instruction to exclude experiences occurring under the influence of alcohol or drugs. [2]
Do not impose the past-week timeframe used by a different dissociation questionnaire. The DES-II instructions and response format belong to this instrument. If an item is unclear, clarify its meaning rather than substituting a different question.
Reading the response options
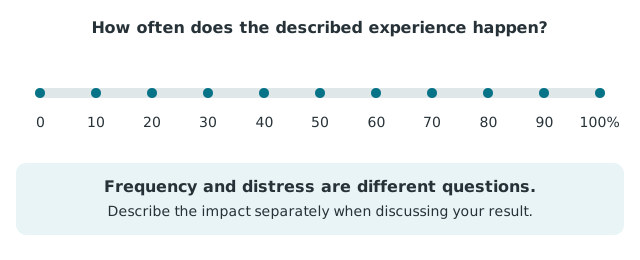
Add all values, then divide by 28
If 28 item values add to 560, the total is 560 ÷ 28 = 20. LuriaLab checks that 28 responses are present and reports the mean to one decimal place. An unanswered item is missing information, not a zero.
Two patterns can produce the same mean
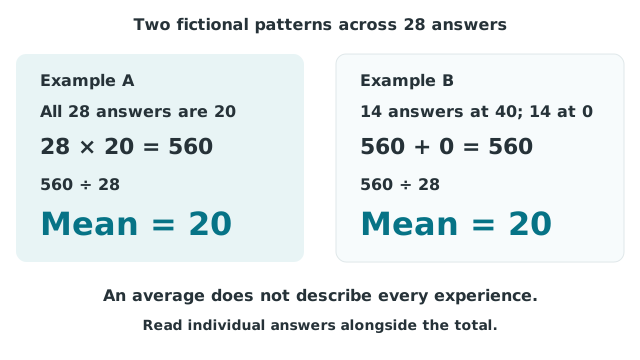
The average gives each item equal weight. It does not tell you which experiences contributed most, whether they overlap or how they affect daily responsibilities. Read the individual responses alongside the total.
Explore the score scale
Where does an example score sit?
Move the slider to explore the numerical thresholds and their limits.

How should display bands be read?
LuriaLab groups results around scores of 10 and 30. These are interpretation aids, not separate diagnoses. The research literature has used 30 as a flag for further investigation, but the total cannot establish DID or another dissociative disorder. [3] [5]
Neither 29.9 nor 30.0 marks a sudden biological change. Before drawing conclusions about a near-threshold result, look at the answers, the experiences behind them and the research setting in which the threshold was studied.
Common calculation mistakes
- Using response positions instead of values: the calculation uses 0, 10, 20 and so on, not an unexplained 0–10 index.
- Keeping the sum as the result: 560 is the item sum in the example, not the standard DES-II total.
- Dividing by answered items only: this changes the calculation and may hide incomplete data.
- Reading the average as a clock: 20 does not prove that someone dissociates for exactly one fifth of every day.
For what to do with the calculated result, read the DES-II results guide.
References
- Bernstein & Putnam (1986). Development, reliability, and validity of a dissociation scale. Journal of Nervous and Mental Disease, 174, 727–735. DOI: 10.1097/00005053-198612000-00004.
- Carlson & Putnam (1993). An update on the Dissociative Experience Scale. Dissociation, 6, 16–27. Paper and DES-II form.
- Carlson et al. (1993). Validity of the DES in screening for multiple personality disorder: a multicenter study. American Journal of Psychiatry, 150, 1030–1036. DOI: 10.1176/ajp.150.7.1030.
- Carlson et al. (2018). Development and validation of the Dissociative Symptoms Scale. Assessment, 25, 84–98.
- LuriaLab. Current DES-II assessment listing.