Autism Spectrum Quotient (AQ)
Start the test- Ages: 16+
- 50 questions
- ~8 min
- Free
DeutschTürkçeMagyarPolskiУкраїнськаEspañolFrançaisPortuguêsNederlandsItalianoРусский
Test guides
AQ-50 validity and reliability
The AQ distinguished selected groups well in its original research. In a specialist referral clinic, scores overlapped substantially among adults with different eventual diagnoses.
| Study and setting | What the result tells us |
|---|---|
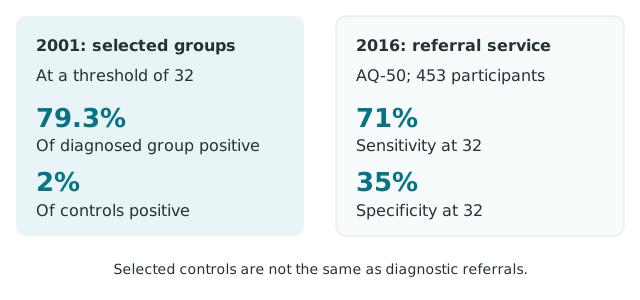
| Cambridge Autism Research Centre, adult AQ and original study | In the original comparison, about 79% of 58 diagnosed adults reached 32, compared with approximately 2% of 174 controls. |
| Woodbury-Smith et al. (2005) | Among 100 consecutive referrals, a threshold of 26 identified more potential cases, with lower specificity. |
| Ashwood et al. (2016), Table 2 | Among 453 referrals with full AQ-50 data, a cutoff of 32 gave 71% sensitivity and 35% specificity. |
How can results differ at the same cutoff?
A specialist clinic sees people referred because of overlapping concerns. Its comparison group differs from volunteers drawn from the wider population. Sensitivity is the proportion of diagnosed participants reaching the threshold. Specificity is the proportion of comparison participants falling below it.
What does reliability add?
Internal consistency asks whether items tend to vary together. Test–retest reliability asks how stable scores are across administrations. Neither determines whether a person meets diagnostic criteria. For a community presentation or referral note, name the form, setting and threshold alongside any accuracy statistic. Cambridge Autism Research Centre, adult AQ and original study; Ashwood et al. (2016), Table 2.
Reliability of the total and domains
In the original study, 17 students repeated the AQ after two weeks. The total-score correlation was r = 0.70. This estimates relative stability over a short interval in a small student sample. It provides limited evidence for judging change in a single clinical case. Baron-Cohen et al. (2001), original AQ validation.
| Domain | Alpha |
|---|---|
| Social skill | 0.77 |
| Attention switching | 0.67 |
| Attention to detail | 0.63 |
| Communication | 0.65 |
| Imagination | 0.65 |
What the referral studies add
Woodbury-Smith and colleagues studied 100 consecutive adult referrals, of whom 73 received the study diagnosis. At ≥26, sensitivity was about 95% and specificity about 52%. A lower cutoff identified more diagnosed participants while also including many participants with other clinical presentations. Woodbury-Smith et al. (2005), referral-clinic validation.
Ashwood and colleagues assessed 476 referred adults. Full AQ-50 data were available for 453. At ≥32, the reported sensitivity was 0.71 (95% CI 0.65–0.75) and specificity 0.35 (0.27–0.44). Their article includes separate AQ-10 results. Use the AQ-50 row when citing this instrument. Ashwood et al. (2016), full AQ-50 analysis in Table 2.
Predictive values depend on how common the diagnosis is in the population assessed. A selected case–control sample, a specialist clinic and an open online questionnaire have different case mixes. The proportion exceeding a cutoff in any of those settings cannot establish a personal probability in another.
Frequently asked questions
Do these numbers apply to the ten-question AQ?
No. The full and short questionnaires have different score ranges. The referral figures on this page use the AQ-50 analysis.